Like Alex Trebek, the bunnies know the answer, there were humongous heat waves in Texas (2011), Russia (2010) and Europe (2003), but what is the question?
Otto, Massey, Oldenborgh, Jones and Allen (Allen being Myles) have two answers, but their answers untangle much of the to and fro about these events. Their bottom line is that the slightly warmer weather event crowd and the climate dice are loaded bunch are both right, because they are asking different questions.
The first asks whether similar heat waves can be found in the meteorological records. The answer, is that similar, although perhaps slightly cooler heat waves can be found in the meteorological records of all these areas, and that the slightly increased temperatures might be a sign of climate change or simply natural variability. Therefore the heat waves are not convincing markers of climate change. Dole, et al "Was there a basis for anticipating the 2010 Russian heat wave?", Geophys. Res. Lett., 38, L06702, doi:10.1029/2010GL046582 have been pushing this answer, and, of course, any number of Eli's friends.
The second asks how frequent such heat waves were in the past and are now. Here one finds a significantly higher percentage of extreme (three sigma) events and assigns the recurrence of such events and the events themselves as markers of climate change. Hansen, Ruedy and Sato and Rahmstorf and Coumou (2011), "Increase of extreme events in a warming world", Proc. Natl. Acad. Sci. U. S. A., 108(44), 17905–17909. are two of those holding this view. On the bloggish side Michael Tobis has been the strongest voice.
Otto, et al., have a nice figure illustrating this. Using climateprediction.net they created a large ensemble which they examined for significant heat waves.
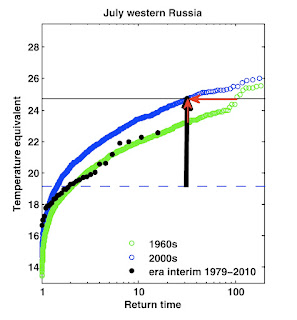
"These two approaches are different but complementary in quantifying the role of human influence on a 2010-like Russian heat wave. This is illustrated by Figure 4, which shows return times of the heat wave conditions for the 1960s (green) and 2000s (blue). The threshold exceeded in 2010 is shown by the solid horizontal line, which is more than 5°C above 1960s mean July temperatures, shown by the dashed line. The difference between the green and the blue lines could be characterized as a 1°C increase in the magnitude of a 33-year event as shown by the vertical red arrow. This arrow is substantially smaller than the size of the anomaly itself, supporting the assertion that the event was “mainly natural” in terms of magnitude which is consistent with D11. Alternatively it could be characterized as a three-fold increase in the risk of the 2010 threshold being exceeded, supporting the assertion that the risk of the event occurring was mainly attributable to the external trend."
In other words, nature made it a record. Climate change made it a phenomenal record.
although he would not have won the Daily Double.

 "These two approaches are different but complementary in quantifying the role of human influence on a 2010-like Russian heat wave. This is illustrated by Figure 4, which shows return times of the heat wave conditions for the 1960s (green) and 2000s (blue). The threshold exceeded in 2010 is shown by the solid horizontal line, which is more than 5°C above 1960s mean July temperatures, shown by the dashed line. The difference between the green and the blue lines could be characterized as a 1°C increase in the magnitude of a 33-year event as shown by the vertical red arrow. This arrow is substantially smaller than the size of the anomaly itself, supporting the assertion that the event was “mainly natural” in terms of magnitude which is consistent with D11. Alternatively it could be characterized as a three-fold increase in the risk of the 2010 threshold being exceeded, supporting the assertion that the risk of the event occurring was mainly attributable to the external trend."


9 comments:
what's a "return time"
and -- looking where that's over 100 -- why does "temperature equivalent
have that wiggle at return times around 100?
Oh, and, about reaching 25 degrees:
looks like a temperature of special interest to eelgrass, at least:
http://www.pnas.org/content/102/8/2826/F1.medium.gif
That turned up finding 'return time':
"... Our experiment coincided with a period of an unprecedented heat wave that hit Europe in 2003 (16, 17). According to historical climate records, the return time for this extreme warming event was predicted to be [greater than] 10,000 years. Nevertheless, it can been viewed as precursor for ..."
Ecosystem recovery after climatic extremes ....
"what's a "return time"
Hank, I'm shocked. Given the context I thought the meaning was pretty clear.
If forest desiccation and subsequent fire spread is your metric of choice, the recent Russian event is up there with the 1915 Siberian megafire.
OTOH the increased population means more people complaining about the weather and lighting matches in the taiga
More OTOH, Russell:
presently much, much more effective fire fighting and monitoring.
Marco
Another aside -- a lot of different combinations, not just peak temperature, make a difference in your life.* Tracking changes in these factors is going on.
_______
* At least if you're a mussel
http://jeb.biologists.org/content/213/6/995.full
Hank: Another aside -- a lot of different combinations, not just peak temperature, make a difference in your life.
I suppose that's what struck me about the hail storm in Dallas earlier this week.
Insured losses from the massive hailstorm that struck the Dallas area on Wednesday could reach as much as $2 billion, making it one of the most costly storms of its type in U.S. history, an insurance organization said on Friday.
...
According to the Insurance Information Institute, over the 20 years ending in 2010, total hail, wind and flood losses nationwide were just $14 billion
Reuters
I'm can't comment on the provenance or uniqueness of this storm but it make me think about our focus on rain, drought and temperature as the principle impacts of GW for non-coastal areas. More storms like the above would not only be ruinous, but how exactly do you "adapt" to more routine occurrences of baseball sized chunks of ice falling out of the sky? More active convection is a given in the scenario we're entering so presumably we can expect more supersized storms.
Not much in the literature about hail in the years going forward.
Marco has a point about European Russia, but outside of logging centers like Chita, firefighters are few and far between beyond the Urals.
These are nice ways to look at the probability of these heat waves from a probability POV based either on prior meteorological record biased by global warming to see if the dice has been loaded, and even estimated how much the dice have been loaded.
Another approach to studying these events tries to identify whether the meteorology of the earth has changed. Prolonged weather patterns produces a heat wave, instead of a hot week. And prolonged weather patterns depend on the positioning of the jet stream. The direct cause of all three events in your post was a stalled jet stream (a blocking pattern in the jet stream).
I find the work by Jennifer Francis at Rutgers on evaluating the amplitude and persistence of jet stream patterns extremely interesting. Peter Sinclair has put out some nice videos on this, and there is a 16 minute video on youtube of her talking about her work. The paper she published in February is worth reading.
If the theory is correct, that Arctic amplification reduced ice pack alters the jet stream patterns, leading to prolonged weather patterns, then we have entered a new meteorological system. Then shifted probability curves (based on the old meteorology) don't really make sense. The new meteorology we have created could have a very different probability curve for prolonged heat waves (as well as droughts, cold spells, extreme and prolonged flooding events, major snowstorms) in the NH than the prior meteorology.
Post a Comment